






Updated 3 months ago
Why That Low Quote Doesn’t Tell the Whole Story
SCARECROW GARDEN SUPPLIER
Why Cheap Nursery Trays Cost More: PS vs PP TCO Guide | Scarecrow Garden Supplier
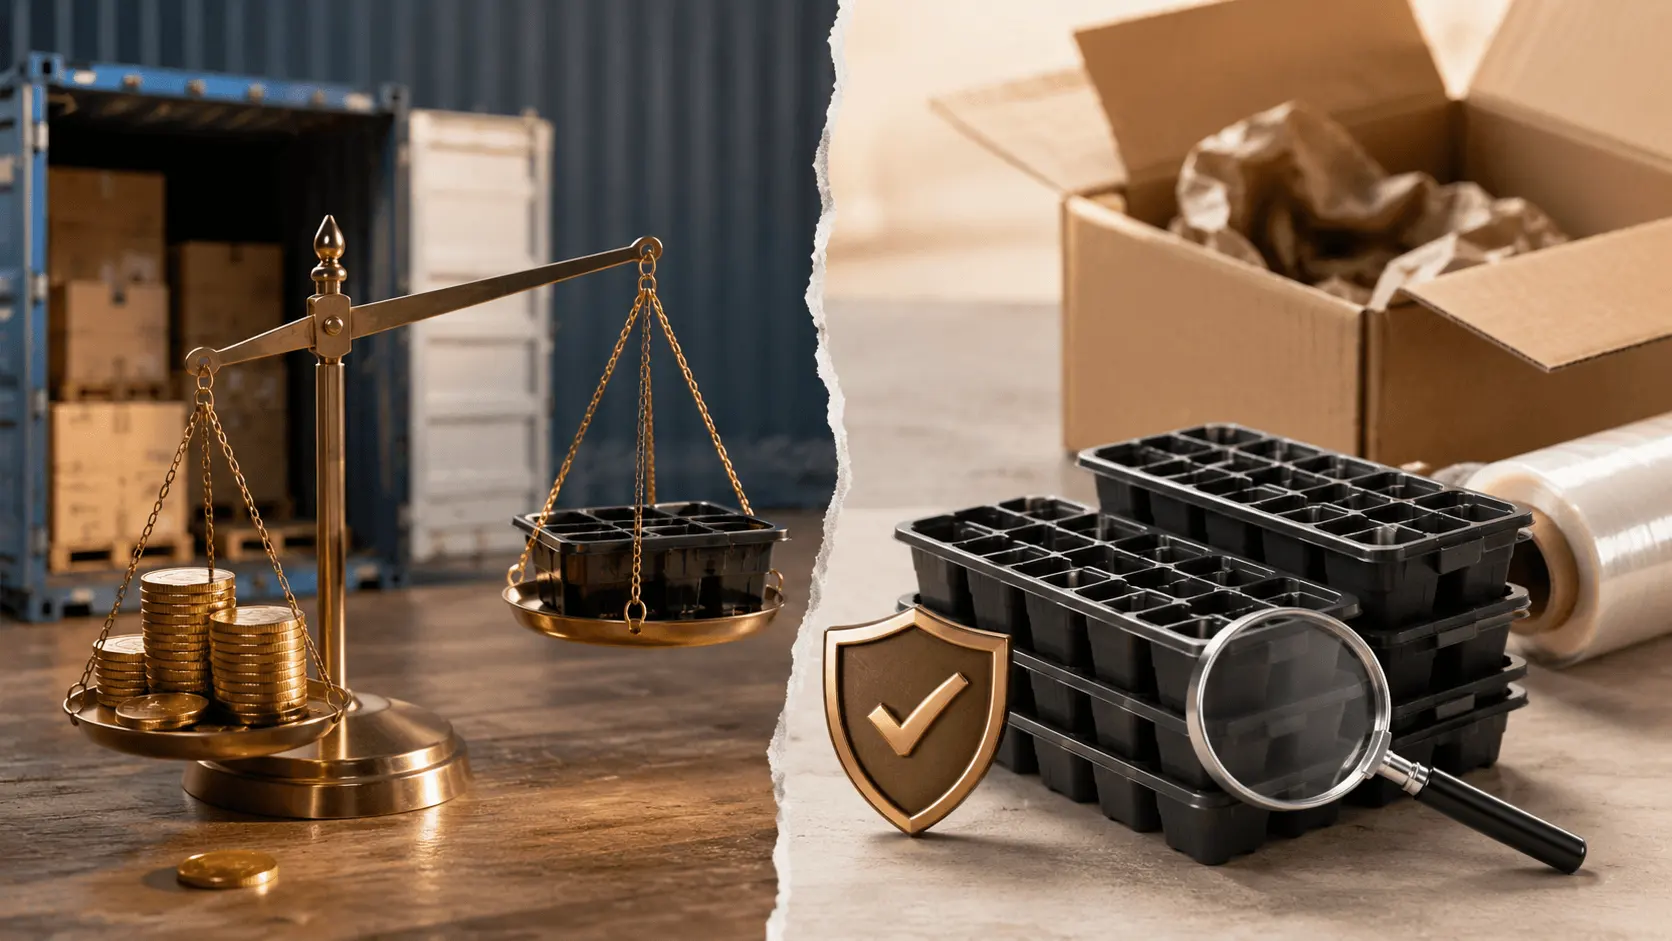
You’ve seen it before. Three quotes land on your desk for the same 128-cell nursery tray. One stands out — noticeably lower. The supplier seems responsive, the specs look fine on paper, and the price gap is hard to ignore. You start thinking: maybe this is the one.
But here’s the thing. That quote only tells you what you pay at the point of purchase. It doesn’t tell you what happens after the trays arrive — and that’s where the real cost lives.
The purchase price is just the tip of the iceberg. Below the waterline, there are costs you don’t see on any quote: trays that crack in transit, replacements you have to reorder, production schedules that get pushed back, cleaning cycles that take longer than they should, and trays that need to be thrown out after one or two growing seasons. These are the hidden costs — and they tend to pile up fastest on the trays that came with the lowest price tag.
In nursery supply sourcing season after season, the lowest quote keeps showing up — and the highest total cost keeps following it.
If your nursery tray sourcing plan only considers the purchase price, it’s missing the costs that matter most over time. Want to check whether your current sourcing plan accounts for these hidden costs? [Talk to us about a TCO review for your nursery tray purchases.]
The Material Behind the Price Tag: Why PS Trays Cost More Than You Think
Most budget nursery trays on the market are made from polystyrene — PS, or sometimes HIPS (high-impact polystyrene, which adds 5–10% polybutadiene to improve toughness). PS is cheap to mold, easy to produce, and widely available. These are the reasons it shows up in the lowest quotes.
But PS has a structural weakness that directly affects your bottom line: it is brittle. The elongation at break for PS ranges from just 1.2% to 3.6% — meaning it has almost no capacity for plastic deformation before it fractures. When a PS tray is dropped, pressed under a stack, or bumped during loading, it doesn’t bend. It breaks.
Compare that to polypropylene (PP). PP’s elongation at break ranges from 100% to over 600% — roughly 30 to 170 times the flexibility of PS. A PP tray absorbs impact. It bends, it flexes, and it returns to shape. That difference isn’t just a material science statistic. It translates directly into how many intact trays you receive, how many you can reuse, and how often you have to reorder.
And here’s the detail most buyers miss: PP raw material actually costs less than PS. Based on industry experience, PP resin runs approximately 1.0–1.5 USD/kg, while PS resin sits at 2.1–2.3 USD/kg. The reason those PS trays appear cheaper on the quote isn’t because the material itself is cheaper. It’s because they’re produced with thinner walls and higher recycled content — two shortcuts that reduce upfront cost but increase the downstream costs you don’t see on the quote. A lower quote doesn’t always mean a lower-cost material. Sometimes it means someone found a way to make a more expensive material look cheaper — by cutting the things that make it work.
How Material Properties Translate to Your Costs
| Property | PS (Polystyrene) | PP (Polypropylene) | What This Means for Your Costs |
| Elongation at break | 1.2–3.6% | 100–600%+ | PS trays crack under normal handling → more replacements, more reorders |
| Brittleness threshold | Brittle at room temperature | Becomes brittle only below 0°C | PS trays can fail in everyday greenhouse conditions; PP trays handle cold storage and winter transport |
| Maximum service temperature | ~70°C (GPPS) | 130°C | PS trays cannot be steam sterilized → chemical cleaning only, less thorough, slower turnaround |
| Steam sterilizable | No | Yes | PP trays can be autoclaved → faster, more thorough disinfection, fewer disease cycles |
| Raw material price | 2.1–2.3 USD/kg | ~1.0–1.5 USD/kg* | Lower PP material cost means the price gap on budget PS trays comes from thinner walls and more recycled content — not cheaper resin |
*PP and PS raw material prices are based on industry experience and fluctuate with market conditions.
The table above isn’t a material science comparison. It’s a cost comparison. Next time you open a carton of PS trays and find 10% cracked — that 1.2–3.6% elongation at break isn’t a material spec anymore. It’s the reason you’re placing another order.
The Hidden Cost Chain: From Damaged Trays to Disrupted Production
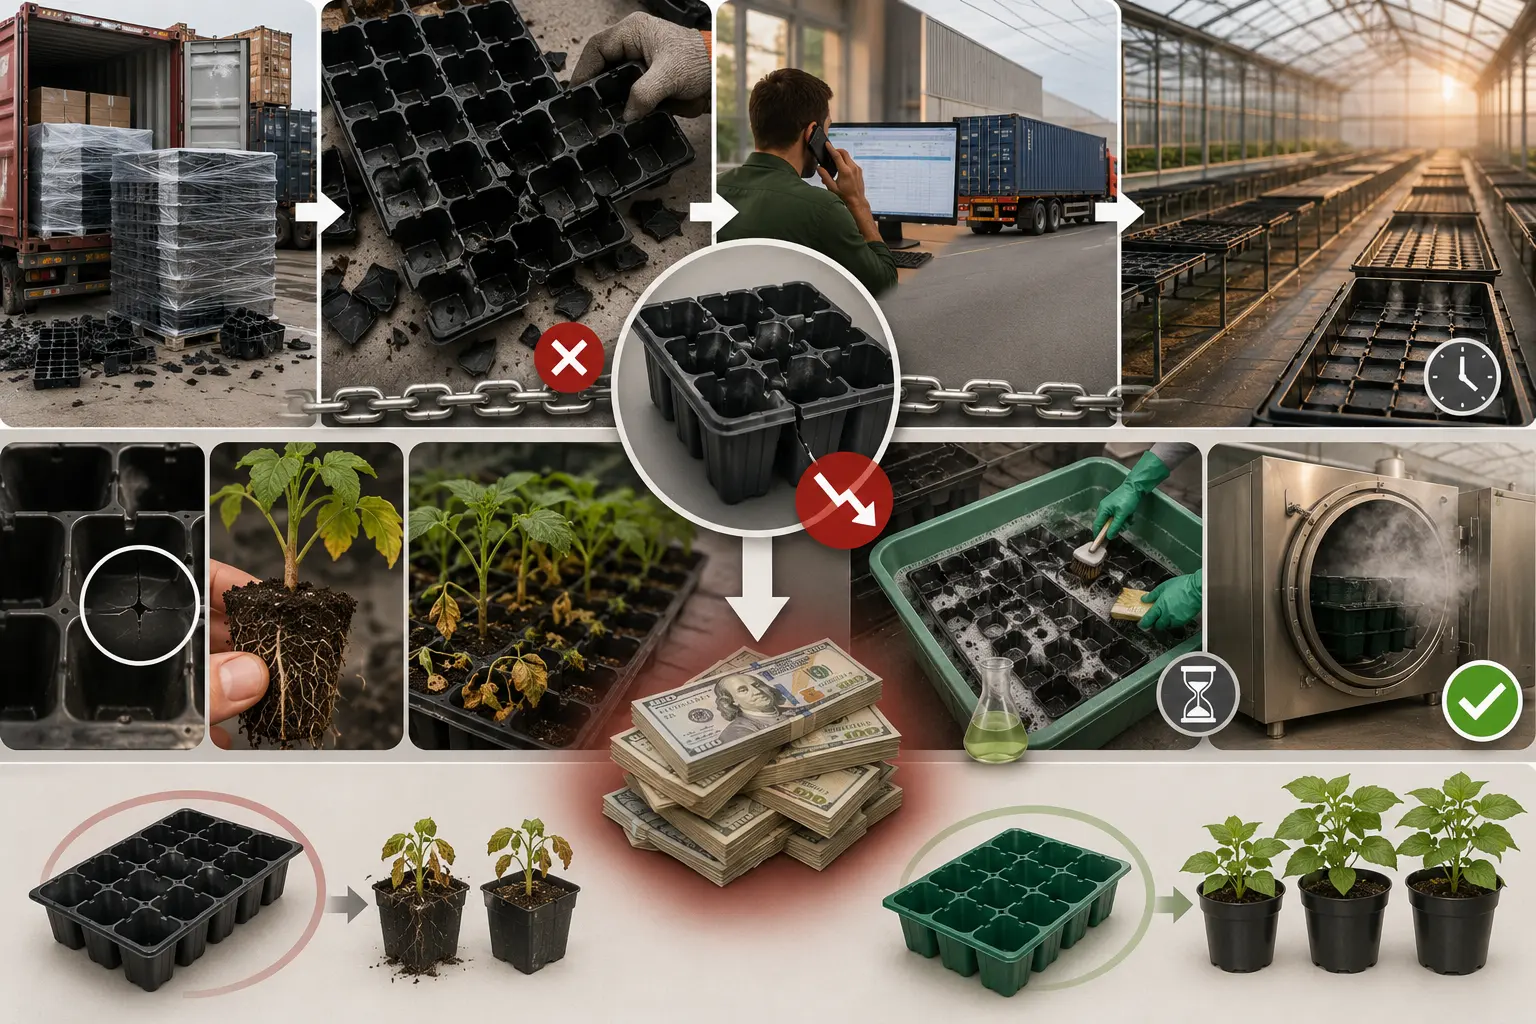
When you choose a tray based on the lowest purchase price, you’re not just buying a product. You’re signing up for a chain of costs that unfolds over time — and each link in that chain costs more than the price difference you saved.
Damaged trays → replacement cycles
Picture this: a container of nursery trays arrives at your facility. You open the cartons and find that roughly 10% of the PS trays are cracked or shattered (based on industry experience; actual rates vary with shipping mode and handling) — corners broken, cell walls split, some trays unusable altogether. (As we covered in our shipping damage guide, PS products are especially vulnerable in transit, and LCL shipments see approximately three times the damage rate of FCL.)
Now you need to reorder those trays. That means: contacting the supplier, waiting for production, waiting for shipping, and occupying greenhouse space that was supposed to be filled with seedlings this week. You pull trays from your backup stock if you have one — or you leave benches empty while you wait. The planting schedule shifts. The window for that crop narrows. And every day that bench sits empty is a day of lost growing time you can’t recover at the end of the season.
The cost of that delay doesn’t show up on any invoice — but it shows up in your harvest timing, your market window, and your revenue for that season.
To prevent transit breakage from driving up your replacement costs, see our packing protocol in [How to Reduce Shipping Damage to Clear Humidity Domes and Plastic Nursery Trays].
Invisible damage → production losses
The trays that survived transit aren’t necessarily fine. PS trays can develop micro-cracks — cracks too small to see but large enough to affect root development, water drainage, or structural integrity once the tray is loaded with substrate and plants. This is invisible damage. You don’t notice it until seedlings start failing, trays start warping under the weight of wet media, or cells collapse mid-season.
When that happens, the cost cascades: the seeds you planted, the substrate you filled, the greenhouse bench space you allocated, the labor you invested in transplanting — all of it goes down with the tray. And the crop that was supposed to hit the market in week 12 now hits in week 14, or doesn’t hit at all. That’s not a tray replacement cost. That’s a production loss — and in many operations, a single production loss from tray failure can exceed the entire purchase price of the tray order.
A tray might cost you $0.30 per unit. But the seedling it holds — including the seed, the substrate, the bench space, the labor, and the market value of that plant at harvest — represents$2.00 to $5.00 or more of invested value. When the tray fails and the seedling dies, you don’t lose$0.30. You lose the full invested value of that plant. The tray was the cheapest component in the chain — and it was the one that broke.
Cleaning and disinfection → time and risk
Between growing cycles, trays need to be cleaned and disinfected. PS trays can’t withstand high-temperature sterilization — they deform at around 70°C. Your only option is chemical cleaning: soaking, scrubbing, rinsing, and then waiting for residues to dissipate. It takes more time, it’s less thorough, and there’s a residual risk that pathogens survive the process — especially Pythium and other waterborne organisms that thrive in nursery environments.
PP trays can be steam sterilized (autoclaved) at 130°C. One cycle through a steam unit, and you’re back to a clean tray with a significantly lower risk of pathogen carryover. Faster turnaround. More thorough disinfection. Fewer disease problems in the next cycle. That time savings and risk reduction compounds across every growing season — and in operations running tight cycle schedules, the difference between a typically 2-hour chemical soak and a typically 30-minute autoclave cycle is the difference between starting your next crop on Monday or waiting until Wednesday.
Service life → amortization
Here’s where the math shifts. Based on industry experience, PS nursery trays typically last 1 to 3 growing cycles before they need to be replaced — the cumulative effect of brittleness, micro-cracking, and chemical cleaning degradation. PP trays, by contrast, commonly last 5 to 10 or more cycles — the material’s flexibility and thermal resilience mean each cycle leaves the tray closer to its original condition.
When you amortize the purchase price across the actual number of cycles a tray survives, the per-cycle cost flips. A PS tray that costs 30% less at purchase but lasts only 1–2 cycles ends up costing more per cycle than a PP tray that runs 5–10 cycles. The cheaper tray isn’t cheaper per use. It’s cheaper per purchase — and more expensive per season.
Here’s a quick way to think about it: if a PS tray costs $0.30 and lasts 2 cycles, you’re paying$0.15 per cycle just for the tray itself. If a PP tray costs $0.45 (50% more at purchase) and lasts 8 cycles, you’re paying$0.056 per cycle. The tray that cost more to buy costs less to use — by a factor of nearly three. And that’s before you add the damage, cleaning, and production loss costs that accumulate on the PS side.
Four hidden cost dimensions. One chain. And each link costs more than the price gap you saved at the start. Want to see a TCO comparison for the nursery tray materials you’re considering? [Send us your product list, quantities, and packaging requirements — we’ll help you map out the full cost picture.]
Thin Walls and Recycled Content: How Budget Trays Cut Costs—and What You Lose
If PP resin costs less than PS resin, then why do PS trays appear cheaper on the quote? The answer is in two places: wall thickness and recycled content.
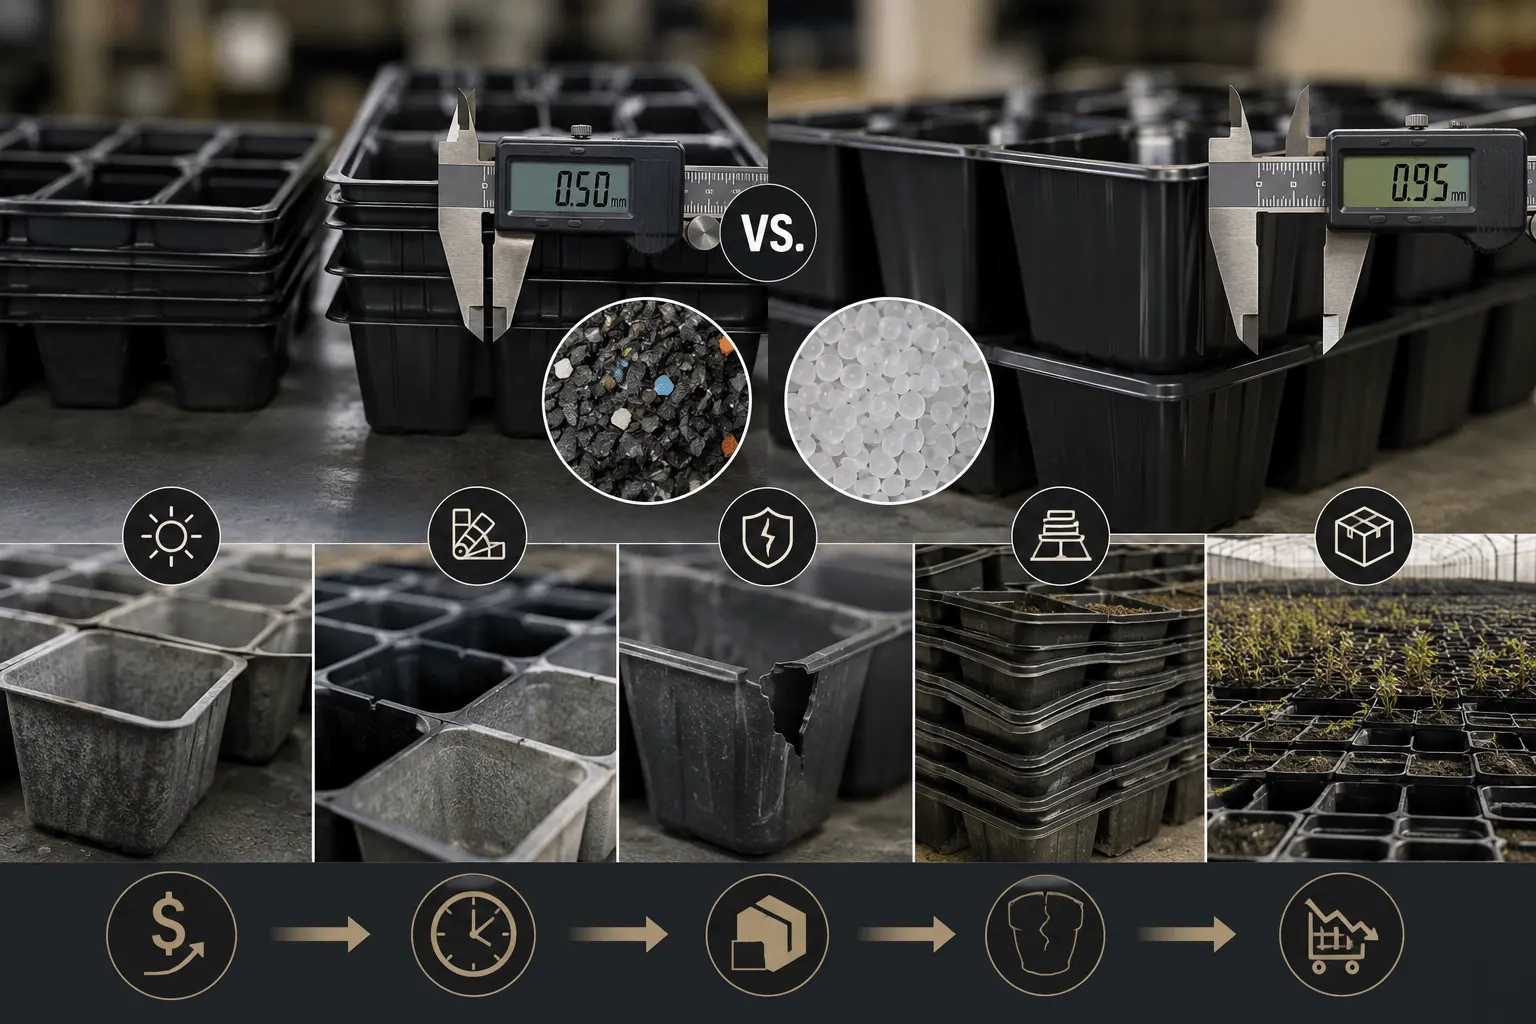
Budget PS trays reduce wall thickness by 30–50% compared to standard trays — moving from 0.8–1.0mm down to 0.4–0.6mm. That’s a significant reduction. But wall thickness and structural strength don’t scale linearly. A 30–50% reduction in wall thickness typically reduces load-bearing capacity and impact resistance disproportionately — the strength loss is often significantly greater than the thickness reduction, based on industry experience. The tray becomes disproportionately weaker — not just proportionally thinner. A tray that looks almost the same as a standard one on the outside can behave very differently when you stack it, load it with wet substrate, or ship it across an ocean.
Managing your SKU count with bundled tray sets can also offset high material costs; learn more in [How Mixed Packing Reduces Excess Inventory of Trays, Inserts and Domes].
Higher recycled content is the other lever. Budget trays often use a greater proportion of recycled PS in their resin mix. More recycled content means more variability: inconsistent color across the same batch (which affects your brand presentation if you sell trays as part of a retail kit), reduced UV resistance for outdoor use, and mechanical properties that fluctuate from one tray to the next. Two trays from the same carton might perform differently — one holds up through the season, the other cracks on the first use. You can’t tell which one is which by looking at them.
That unpredictability is itself a cost. When you can’t predict which trays will fail, you can’t plan your production schedule with confidence. You hold extra inventory as a buffer — ordering more than you need because you know some won’t survive the season. You spend time inspecting trays before each cycle, pulling out the ones that look suspect. You absorb losses you didn’t anticipate — trays that cracked mid-cycle, seedlings that died because the cell wall gave way, benches that went empty when they should have been full.
The quote didn’t include any of this — but your season did. And this is the cost that’s hardest to budget for, because it’s not a fixed amount. It’s a range of possibilities that all trend in the same direction: toward more expense, more waste, and less predictability.
What TCO Actually Looks Like: A Per-Cycle Comparison
Let’s put numbers on this. The table below shows an illustrative per-cycle cost comparison between a budget PS tray and a standard PP tray, based on typical industry scenarios. (Actual costs depend on your specific product, supplier, order volume, and growing cycle length — these figures are illustrative, not commitments.)
Per-Cycle Cost Comparison: Budget PS Tray vs Standard PP Tray
| Cost Dimension | Budget PS Tray (Illustrative) | Standard PP Tray (Illustrative) | Notes |
| Purchase price per tray | Lower | Higher (typically 30–50% more) | The only cost visible on the quote |
| Estimated service life | 1–3 cycles* | 5–10+ cycles* | *Based on industry experience; actual life depends on handling and cleaning practices |
| Amortized purchase cost per cycle | Higher | Lower | A tray lasting 2 cycles amortizes its cost over 2 uses; a tray lasting 8 cycles amortizes over 8 — the per-cycle cost flips |
| Damage/replacement rate per order | Higher (PS is brittle; more trays arrive damaged or fail early) | Lower (PP flexes under impact; fewer replacements needed) | Based on industry experience; actual rates depend on shipping mode and handling |
| Cleaning/disinfection time per cycle | Longer (chemical cleaning only; no steam sterilization) | Shorter (steam sterilization possible; faster turnaround) | PP’s 130°C tolerance enables autoclaving; PS deforms at ~70°C |
| Production loss risk per cycle | Higher (invisible damage → seedling loss → schedule delays) | Lower (PP trays maintain structural integrity through typical growing cycles) | Risk is cumulative across seasons |
That’s the pattern.
Now look at what it means for your season. You ordered 5,000 PS trays at 30% less than the PP quote. By the end of season one, you’ve reordered 500 replacements, lost two weeks of growing time, spent extra hours on chemical cleaning, and thrown away trays that lasted one cycle. The 30% saving? It’s gone — and you’re ordering again for season two.
This isn’t a theoretical model. It’s a pattern that shows up in real nursery operations, season after season. The purchase price gap might be 30%. The per-cycle total cost gap can be significantly larger based on industry experience — because every hidden cost compounds on the side of the cheaper tray.
Next Step: Review Your Nursery Tray Sourcing Plan
If your current sourcing plan evaluates nursery trays by purchase price alone, it’s missing the costs that accumulate over every growing cycle — damage, replacement, production losses, cleaning time, and service life amortization. A tray that costs less to buy but costs more to use isn’t a saving. It’s a shift: you pay less now, and more later.
The way to make this shift visible is simple: compare trays by per-cycle cost, not by per-unit purchase price. That comparison changes the decision — and it changes the outcome of your season.
A nursery tray sourcing plan built on TCO doesn’t just look at the number on the quote. It looks at how many cycles that tray will survive, how much time you’ll spend cleaning it, how many trays you’ll lose to damage, and how much production risk you’re absorbing with each order. When those factors are part of the decision, in most growing scenarios, the cheaper tray doesn’t win — because it was never actually cheaper. It was just cheaper to buy.
```htmlTest PP Nursery Trays Before Placing Your Wholesale Order
Get nursery tray samples to test PP tray durability and steam sterilization efficiency in your own growing conditions. Send us your product list and target market — we'll set you up with the right samples to evaluate.
Get My Tray Samples →